




How to use a product selection guide to compare total ownership cost




In industrial buying, the lowest purchase price rarely reflects the true cost of a product. A structured product selection guide helps compare total ownership cost by examining performance, energy use, maintenance needs, service life, compliance requirements, supply reliability, and replacement risk. This matters across equipment, materials, chemicals, components, and packaged systems: a cheaper item can become the more expensive choice once downtime, waste, qualification work, or emergency freight are included.
The practical challenge is that total ownership cost is rarely visible in one supplier quotation. Some costs sit with operations, some with maintenance, some with quality, and some only appear when a shipment is late or a product fails under actual process conditions. A useful selection guide brings those costs into one decision framework before a contract is awarded.
Start with the operating decision, not the catalogue comparison
Many comparisons begin with technical specifications and unit price. Both are necessary, but neither answers the central question: what will this option cost to use reliably in the intended application?
For a polymer resin, the relevant issue may be whether a lower-priced grade increases scrap, slows cycle time, or requires more frequent mold cleaning. For a pump, the comparison may turn on energy draw, seal life, spare-part availability, and the cost of an unplanned shutdown. For laboratory reagents, batch consistency, documentation, storage requirements, and requalification effort may outweigh the price per bottle. In steel products or alloys, dimensional consistency and material traceability can determine downstream yield and claims exposure.
A product selection guide should therefore define the operating scenario before comparing suppliers. At minimum, record:
- the application and required output;
- expected annual consumption or operating hours;
- process conditions, including temperature, pressure, corrosion, contamination, or load cycles;
- acceptable failure rate and the consequence of interruption;
- required standards, test reports, certifications, and traceability;
- the planned service period or contract horizon.
Without this baseline, teams often compare products that appear equivalent on paper but impose very different operating burdens.
Build the ownership-cost model around cost drivers that can change
Total ownership cost is not simply purchase price plus freight. It is a forward-looking estimate of costs incurred from qualification through disposal or replacement. The level of detail should match the value and criticality of the purchase, but the categories should be consistent.
A practical model can be expressed as:
Total ownership cost = acquisition cost + implementation cost + operating cost + maintenance cost + failure and disruption cost + compliance cost + end-of-life cost − residual value
Acquisition cost includes the quoted product price, packaging, freight, insurance, duties, inland delivery, and any currency or payment-term impact. For imported industrial goods, comparing Incoterms without normalizing these elements can create a misleading result. An EXW price may look attractive while shifting collection, export handling, and damage risk to the buyer; a DDP offer may simplify delivery but obscure how duties and local clearance are managed.
Implementation cost is frequently underestimated. It can include site installation, commissioning, tooling changes, process validation, employee training, software integration, and initial inspection. A substitute material that requires a new production trial is not a like-for-like replacement, even if its technical data sheet appears similar.
Operating cost is usually the largest differentiator for energy-consuming equipment. Evaluate electricity, fuel, water, consumables, lubricant use, emissions-treatment requirements, and throughput. For equipment with a long operating life, even a modest difference in energy efficiency can exceed the original price gap. However, nameplate efficiency should not be accepted without context. Ask for performance data at the actual duty point, rather than at an idealized test condition.
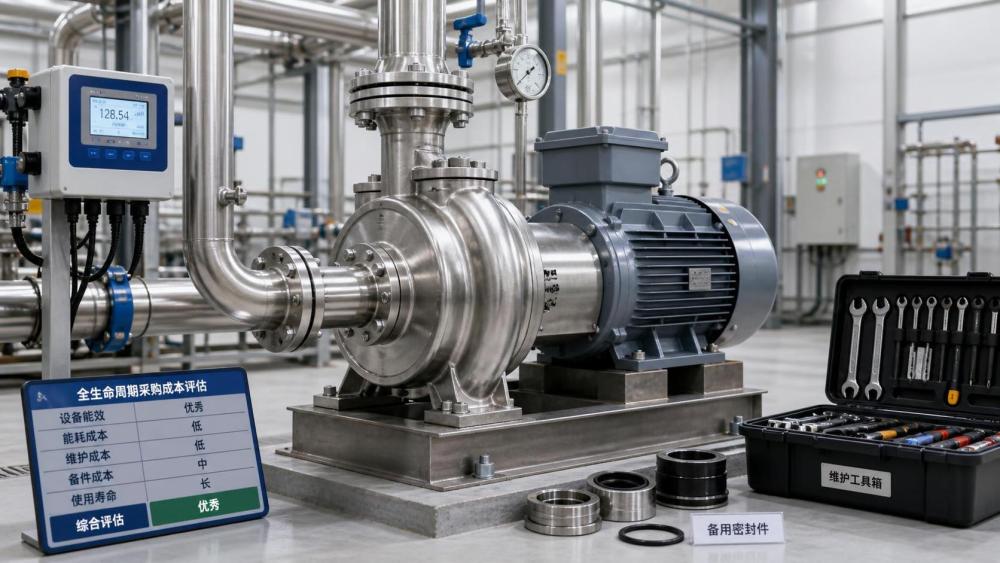
Maintenance cost includes scheduled service, consumables, calibration, inspection, spare parts, labor, and specialist support. The relevant question is not merely whether a supplier offers a warranty. It is whether critical parts can be identified, priced, and delivered within the time required by the operation. A five-year warranty has limited value if a failed controller or seal kit has a long lead time and no local service option.
Failure and disruption cost is often the most difficult element to quantify, yet it is central in critical applications. It may include lost production, product scrap, delayed project milestones, expedited shipping, safety exposure, customer penalties, and the time required to investigate non-conformance. Rather than inventing a precise number, assign a realistic scenario cost and compare how each option changes the likelihood and duration of disruption.
Use comparable assumptions, or the calculation will favor the cheapest quote
The ownership-cost model is only credible if every supplier is assessed against the same assumptions. A common error is allowing one supplier to quote an incomplete base configuration while another includes accessories, test documentation, commissioning support, or a longer service interval. The apparent price advantage may simply reflect a narrower scope.
Normalize the comparison using a single requirement sheet. It should identify the required configuration, annual operating profile, minimum documentation, delivery location, packaging standard, warranty terms, and expected spare-parts package. Where product performance depends on feedstock, ambient conditions, or operator practice, state the assumptions explicitly.
This approach is especially important when comparing different technologies. A higher-capital solution may reduce labor, material waste, energy consumption, or environmental compliance exposure. Conversely, an advanced system may create a dependency on proprietary software, specialized technicians, or imported parts. The guide should identify these trade-offs rather than treating technical sophistication as an automatic benefit.
Turn technical specifications into financial consequences
Technical data has value only when linked to the operating result. Procurement files often contain detailed specifications but no explanation of what an out-of-tolerance parameter means for cost, yield, safety, or delivery.
For each material or equipment category, select a limited number of performance variables with financial relevance. Examples include:
- Metals and alloys: yield strength, corrosion resistance, dimensional tolerance, weldability, heat treatment condition, and mill test certification.
- Chemicals and reagents: purity, impurity profile, shelf life, batch consistency, hazardous-goods classification, and storage requirements.
- Polymers: melt flow, impact performance, moisture sensitivity, recycled-content variability, color consistency, and processing window.
- Process equipment: capacity at duty point, energy use, mean time between service, control-system compatibility, and critical spare-part lead time.
- Energy and sustainability systems: usable capacity, degradation profile, safety controls, monitoring capability, grid or process integration, and disposal obligations.
A selection guide should require evidence appropriate to the risk. Depending on the category, that may mean independent test results, certificates of analysis, inspection records, factory audit findings, material traceability, reference installations, or a controlled trial. A supplier’s declaration can be useful, but it is not always sufficient for regulated, safety-critical, or high-cost applications.
Do not treat supplier reliability as a separate “soft” criterion
Supplier capability directly affects ownership cost. Late deliveries can force production rescheduling or emergency sourcing. Inconsistent batches can increase inspection and rejection costs. Weak technical support can lengthen commissioning. These outcomes should not be relegated to a vague supplier score after the financial comparison is complete.
Assess reliability through observable evidence: production capacity relative to committed volume, lead-time history where available, quality-management records, export experience, packaging practices, response time to technical questions, and the availability of alternate manufacturing locations or qualified distributors. For long-life equipment, examine the supplier’s service organization, parts inventory policy, and written commitments on product support.
Single-source dependence deserves particular attention. The least-cost option may be commercially sensible for a non-critical consumable with readily available substitutes. It is far less defensible for a custom component that can halt a production line. A product selection guide should identify whether a second source can be qualified, whether tooling belongs to the buyer, and whether technical documentation is sufficient to support replacement sourcing if needed.
Compare lifecycle risk alongside the base-case calculation
No ownership-cost estimate is perfectly certain. Energy prices move, shipping lanes are disrupted, exchange rates change, and actual service intervals may differ from supplier claims. The answer is not to abandon the model, but to test its sensitivity.
Run at least three scenarios: an expected case, a high-cost case, and a disruption case. For example, test what happens if energy costs rise, annual utilization is lower than forecast, a key spare part takes longer to arrive, or the product requires replacement earlier than planned. This quickly reveals whether the preferred option remains competitive or only wins under optimistic assumptions.
A useful decision record separates verified facts from estimates. Quoted prices, documented power consumption, certified test data, and contractual lead times belong in the first category. Expected downtime, future freight cost, and output yield may be modeled assumptions. Keeping this distinction clear protects the integrity of the decision and makes later review possible.
Use the guide as a cross-functional record, not a purchasing spreadsheet
Ownership cost crosses organizational boundaries. Operations can validate throughput and process compatibility; maintenance can estimate service labor and spare-part exposure; quality can confirm documentation and inspection requirements; finance can apply discount rates or currency assumptions; legal and compliance teams can review restricted substances, safety documentation, sanctions exposure, and contractual remedies.
The final selection does not have to be the lowest modeled cost. A higher-cost option may be justified where it offers lower supply risk, stronger compliance evidence, better safety performance, or strategic flexibility. What matters is that the premium is visible, reasoned, and proportionate to the consequence of failure.
Used properly, a product selection guide changes the purchasing conversation. Instead of asking which supplier has the lowest quoted price, it asks which option will deliver the required output with the lowest credible cost and the most manageable risk over its working life. That is the comparison that supports durable sourcing decisions.
Related News
- 00
0000-00
Which sectors are driving demand in the chemical engineering market? - 00
0000-00
How to assess lifecycle emissions from CCUS for low-carbon cement - 00
0000-00
How do energy storage technologies compare for 8-hour discharge? - 00
0000-00
Do mill test reports prove industrial alloys meet ASTM standards? - 00
0000-00
How to verify plastic recycling system suppliers' throughput claims
Related tags
Weekly Insights
Stay ahead with our curated technology reports delivered every Monday.