








How Do You Calculate the Payback Period for Energy Storage Systems?
Understanding how to calculate payback period for energy storage systems is essential for evaluating whether a battery project can deliver measurable financial value.
By comparing upfront costs with savings from peak shaving, energy arbitrage, demand-charge reduction, and backup power benefits, businesses can make more informed investment decisions.
Start with the Basic Energy Storage Payback Formula
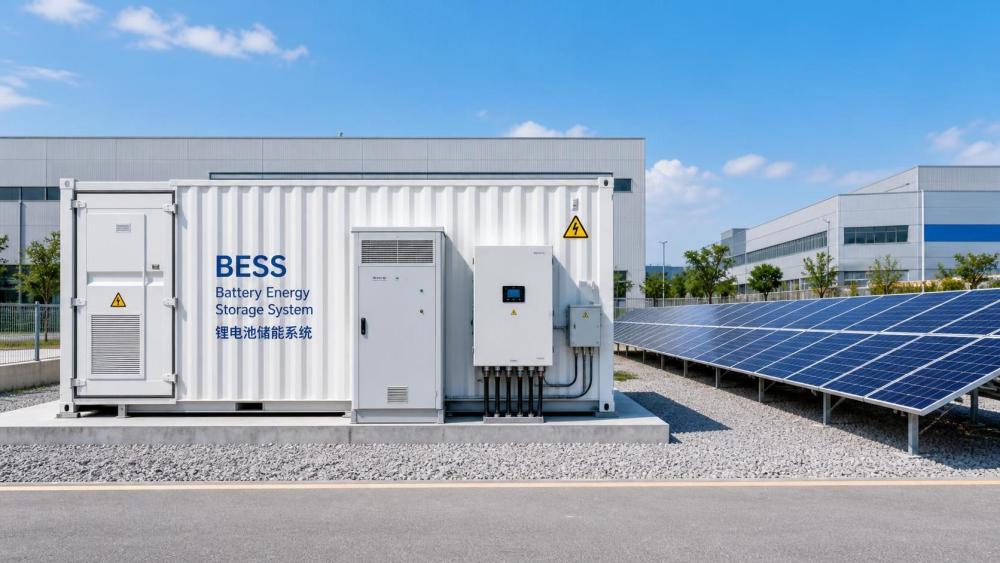
The simple payback period shows how many years of operating savings are required to recover the total installed cost of an energy storage system.
The basic formula is straightforward: Payback Period equals Total Project Cost divided by Annual Net Financial Benefit.
For example, a battery project costing $500,000 that produces $100,000 in annual net savings has a simple payback period of five years.
This calculation is useful for an initial screening, but it does not fully capture battery degradation, financing costs, replacement needs, tax effects, or changing tariffs.
Businesses should therefore treat simple payback as a decision-making indicator rather than the only financial metric used for approving a storage investment.
A shorter payback period generally indicates lower investment risk, provided the estimated savings are realistic, repeatable, and supported by actual site operating data.
For many commercial and industrial projects, an attractive simple payback period may range from three to seven years, depending on local electricity pricing.
However, a longer payback can still be justified where storage protects critical operations, avoids production losses, supports renewable integration, or satisfies resilience requirements.
Define the Full Installed Cost Before Estimating Savings
Accurate payback analysis begins with a complete project cost, not simply the quoted price of battery cells or a containerized storage system.
Total project cost usually includes battery modules, battery management systems, power conversion equipment, controls, enclosures, fire protection, and thermal management.
It should also include engineering, procurement, construction, civil works, grid interconnection, permitting, commissioning, testing, and project management expenses.
For behind-the-meter installations, electrical upgrades can materially affect cost when switchgear, transformers, cabling, metering, or protection systems require modification.
Site conditions matter because difficult access, high ambient temperatures, seismic requirements, limited available space, and fire-code compliance can increase installed costs.
Include recurring costs as well, such as software subscriptions, maintenance contracts, insurance, inspections, communications services, and expected augmentation during the system lifetime.
If a battery is financed, model interest expenses, loan fees, lease payments, and the timing of capital repayments separately from operating savings.
Government grants, tax credits, demand-response incentives, and local storage subsidies should reduce the net project cost only when eligibility is confirmed.
A practical calculation separates gross capital expenditure from incentives, producing a net installed cost that better reflects the investor’s actual cash outlay.
Calculate Annual Savings from the Revenue Streams Available
The annual net financial benefit is usually the most uncertain input, because it depends on tariffs, load patterns, operational strategy, and battery availability.
Do not assume every energy storage system can capture every value stream. The site, market rules, interconnection agreement, and control capability determine eligibility.
For commercial facilities, demand-charge reduction is often the main driver because short peaks can create disproportionate monthly utility charges.
Peak shaving works when the battery discharges during selected high-load intervals, reducing the maximum measured demand used by the utility for billing.
Calculate this benefit by multiplying expected monthly kilowatt reduction by the demand charge, then summing the result across twelve billing months.
Energy arbitrage produces savings when the battery charges during low-price periods and discharges when electricity prices are materially higher.
The arbitrage calculation must account for round-trip efficiency, since a battery cannot return every kilowatt-hour used for charging to the facility.
For example, a system with 90 percent round-trip efficiency requires approximately 1.11 kilowatt-hours of charging energy to deliver one useful kilowatt-hour.
Time-of-use price differentials must be large enough to overcome energy losses, battery degradation costs, operational expenses, and any additional demand charges.
Solar-plus-storage projects can generate value by storing excess photovoltaic output for later use, reducing exports at low compensation rates.
In this case, compare the avoided retail electricity purchase with the export payment that would otherwise have been received for surplus solar generation.
Some sites can earn revenue through demand response, capacity programs, frequency regulation, or other grid services, subject to local market participation rules.
These revenues should be modeled conservatively because program availability, dispatch frequency, performance penalties, and market prices may change over time.
Backup power also has financial value, although it is often harder to quantify than utility-bill savings or direct market revenue.
Estimate resilience value by calculating avoided outage losses, including lost production, spoiled inventory, equipment restart costs, contractual penalties, and safety-related impacts.
Use Interval Data to Estimate Peak Shaving Realistically
Monthly electricity bills alone are rarely sufficient for a credible storage payback calculation because they do not reveal when daily demand peaks occur.
Use at least twelve months of interval load data, preferably at fifteen-minute or hourly resolution, together with the applicable utility tariff structure.
Interval data allows analysts to identify peak duration, peak frequency, seasonal variation, coincidence with solar output, and the required battery power rating.
A short, sharp peak may require high discharge power but relatively modest usable energy capacity to achieve a meaningful demand-charge reduction.
A long afternoon peak may require considerably more battery energy, which can increase project cost and reduce the economic attractiveness of the system.
Simulate each billing interval by applying a dispatch rule, such as limiting facility demand below a predetermined target threshold.
The simulation should prevent impossible dispatch assumptions, including discharging when the battery is empty or charging when site constraints prohibit import increases.
Battery state of charge must be tracked throughout the day because early discharge can leave insufficient capacity for a later and more expensive peak.
Facilities with unpredictable loads should test multiple operating scenarios, especially manufacturers with batch processes, cold storage sites, ports, and large pumping operations.
The result should show annual savings by month, rather than a single average figure, so decision-makers can see whether benefits depend on limited peak events.
Account for Battery Performance, Degradation, and Availability
A battery’s nameplate capacity is not the same as its usable capacity. Operating limits are necessary to protect cells and support warranty compliance.
For payback modeling, use usable kilowatt-hours after considering depth of discharge, reserve requirements, temperature effects, and inverter conversion losses.
Battery capacity gradually declines with age and cycling, reducing the energy available for peak shaving, arbitrage, backup service, or market participation.
Model annual degradation using the supplier warranty assumptions, but compare those assumptions with the planned cycle count and expected operating temperature.
High-frequency dispatch may increase near-term savings while accelerating degradation, particularly when the operating strategy relies on repeated deep cycling.
Some projects require augmentation, meaning additional battery modules are installed later to maintain contractual capacity or target operating performance.
Augmentation costs should be included as future cash outflows when the business case depends on maintaining a specified capacity for many years.
Availability also affects revenue. Scheduled maintenance, communication failures, inverter outages, and grid restrictions can reduce the hours available for dispatch.
A prudent model applies an availability factor and avoids assuming perfect operation throughout the storage system’s useful life.
Ask suppliers for clear documentation covering warranted capacity retention, throughput limits, response capability, maintenance requirements, and exclusions that could affect expected returns.
Calculate Net Savings Rather Than Gross Utility-Bill Reduction
Gross savings can make a project appear more attractive than it truly is. Payback should be based on net annual benefit after recurring costs.
Subtract electricity used to charge the battery, maintenance expenses, platform fees, insurance increases, operator costs, and reserve funding for future replacements.
Where storage participates in grid programs, include aggregator fees, settlement costs, telemetry charges, performance penalties, and revenue-sharing arrangements.
Tax treatment can affect the final investment result, particularly for businesses able to depreciate equipment or claim investment-related incentives.
Work with finance and tax advisers to determine whether incentives are taxable, transferable, refundable, or subject to operational conditions after installation.
Use a conservative electricity-price escalation assumption rather than assuming every tariff component will rise at the same annual rate.
Demand charges, volumetric energy prices, export compensation, and market-service payments can move differently, creating uncertainty in projected cash flows.
A useful model presents low, base, and high cases, allowing management to understand the payback range rather than relying on one optimistic estimate.
For example, a base-case payback of five years may become seven years under lower peak demand or reduced incentive revenue.
Worked Example: Commercial Peak Shaving and Solar Storage
Consider a manufacturing facility planning a 1 MW / 2 MWh lithium-ion battery energy storage system behind its utility meter.
The gross installed cost is $900,000, including equipment, engineering, installation, controls, fire protection, commissioning, and required electrical upgrades.
The facility receives a confirmed incentive of $150,000, reducing the net installed cost used in the simple payback calculation to $750,000.
Interval data shows that the battery can reduce billed demand by an average of 400 kW during high-charge periods across the year.
At an average demand charge of $18 per kW each month, estimated annual demand-charge savings equal $86,400.
Solar shifting and time-of-use arbitrage provide an additional $42,000 in annual avoided electricity purchases after accounting for round-trip efficiency.
The site also expects $20,000 annually from a qualified demand-response program, based on a conservative participation and performance assumption.
Gross annual benefits therefore total $148,400 before recurring expenses and charging-related energy costs are deducted.
Annual operating costs, software, insurance, maintenance, and incremental charging expenses total $28,400, resulting in net annual savings of $120,000.
The simple payback period is $750,000 divided by $120,000, which equals approximately 6.25 years.
Management should then test whether the project remains acceptable if battery availability falls, demand charges decline, or degradation reduces usable capacity sooner than expected.
Compare Simple Payback with NPV and Internal Rate of Return
Simple payback is easy to understand, but it ignores the time value of money and does not measure savings received after the investment is recovered.
For larger projects, calculate net present value, or NPV, by discounting future annual cash flows back to their present economic value.
A positive NPV indicates that projected returns exceed the company’s required return threshold, based on the selected discount rate and project assumptions.
Internal rate of return, or IRR, estimates the annualized return implied by the project’s future cash flows and initial capital investment.
These metrics are especially valuable when comparing energy storage with alternative investments, such as efficiency upgrades, solar expansion, generators, or production equipment.
Discounted cash-flow analysis should include the full expected operating life, residual value where applicable, degradation, augmentation, and decommissioning obligations.
Do not compare projects using payback alone when their lifetimes, risk profiles, revenue certainty, or strategic importance differ substantially.
Identify Risks That Can Lengthen the Payback Period
The largest financial risk is often not battery technology; it is an inaccurate assumption about future operational value at the specific site.
Tariff changes can reduce demand-charge savings or alter time-of-use price spreads, weakening an arbitrage-based business case after installation.
Load changes can also affect results. Energy efficiency projects, production expansion, electrification, or altered operating hours may reshape peak demand patterns.
Interconnection limits may prevent charging, exporting, or participating in grid services at the times assumed in the original financial model.
Warranty terms deserve close review because exclusions relating to ambient temperature, cycle limits, state-of-charge windows, or dispatch patterns can affect lifetime economics.
Supplier creditworthiness matters when long-term performance guarantees are central to the investment case, particularly for large industrial storage deployments.
Develop a risk register that assigns each assumption an owner, data source, confidence level, and mitigation action before seeking final capital approval.
Independent technical review can be worthwhile for complex projects involving multiple revenue streams, utility-market participation, or significant production continuity requirements.
Build a Decision-Ready Payback Model
A useful storage payback model should be transparent enough for finance, operations, engineering, and procurement teams to challenge the underlying assumptions.
Begin with actual electricity bills, interval demand data, tariff documents, load forecasts, solar generation data, and documented operational constraints.
Then define battery size, usable capacity, power rating, efficiency, availability, degradation, dispatch rules, operating costs, incentives, and replacement assumptions.
Present monthly and annual results, not only lifetime totals, because early cash flow performance often matters most for investment approval.
Include sensitivity tests for demand charges, electricity-price spreads, system cost, incentive availability, cycle frequency, degradation rate, and battery uptime.
Finally, confirm that the preferred operating strategy is practical for the site team and compatible with safety procedures, production schedules, and utility requirements.
Conclusion
Learning how to calculate payback period for energy storage systems means connecting realistic installed costs with verified, site-specific annual net savings.
The strongest business cases usually combine interval-data analysis, conservative battery performance assumptions, credible tariff savings, and clearly documented incentive eligibility.
Simple payback provides a fast first answer, while NPV, IRR, sensitivity analysis, and operational risk review provide the confidence needed for larger decisions.
Before selecting a supplier or system size, compare technical specifications, warranty terms, local market rules, and projected revenue streams using consistent assumptions.